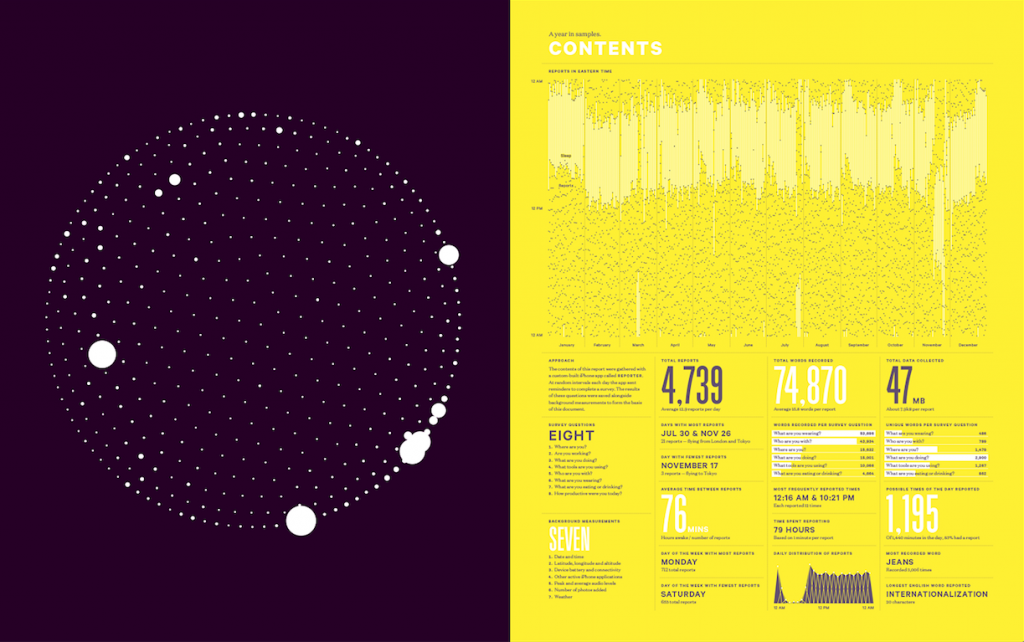
From Data to Design: How to Create an Infographic in 5 Easy Steps
Last month in our blog ‘Showing is Better Than Telling: How to Use an Infographic for Engagement’ we talked about the powerful way infographics add context and story to data, and how their irresistible shareability make them ideal for digital marketing. Today we are going to delve into the process of translating raw data into clear and relevant visuals. There are three key ingredients that must be balanced in any great infographics recipe: visuals, content and information. Finding a compelling way to organize and show information can be a very confusing and...


